

Our mortgage rate forecast November 2026 looks at where New Zealand home loan rates could head next and what that means if you’re choosing a fixed term. I compare the projected costs of fixing for one, two, three or five years, and explain when paying more for certainty may make sense.
On Wednesday the Reserve Bank held its October review of the Official Cash Rate and, against the expectations of just about everyone including me, left the rate at 2.75%. All five bank economics teams had a rise pencilled in and the wholesale market had one about 95% priced. The Committee itself only got there on a four to three vote, with the Governor among the four who preferred to wait and see what the July and September increases are doing before adding to them.
For a borrower the decision matters mainly for what it did to swap rates, which are what fixed mortgage rates are built from. The two year swap dropped from 4.11% to about 4.00% within an hour of the announcement and the one year from 3.82% to about 3.67%, which gives back roughly a third of the rise since the September Monetary Policy Statement (MPS). I would not read too much into that for the advertised mortgage table. The banks had not fully passed on the September rise in the first place, so there is not much for them to hand back, and as I write none of the major banks has changed a fixed rate.
Of more interest to me is where the economists landed afterwards. Every bank has shifted its next hike to the 9 December MPS, and not one of them has lowered its peak. ASB actually lifted theirs to 3.50% the week before the decision, and Kiwibank now has 3.25% pencilled in for next year rather than 3.00%. So the market has come down a little and the forecasts have drifted up, which leaves the gap between the two, the thing I have been writing about since June, at about half the size it was a fortnight ago. It has narrowed rather than closed. Rolling one year fixes still comes out cheaper than a two, three or five year fix under nearly every forecast I follow, and I set the numbers out below.
Advertised rates kept moving up through October as the banks caught up with September’s swap rate rise, though not evenly across terms. The one year specials, which were 4.99% everywhere at the start of the month, have split, with ANZ, ASB and SBS still at 4.99% while BNZ and Westpac have gone to 5.19%. Three year specials at the big banks are now 5.59% and five year specials 5.75%. The two year has gone the other way, oddly enough. Most banks now advertise 5.35% against 5.45% to 5.49% at the end of August, and Westpac is down at 5.29%.
| Bank | 1YR | 18M | 2YR | 3YR | 5YR |
|---|---|---|---|---|---|
| ANZ | 4.99 | 5.29 | 5.35 | 5.59 | n/a |
| ASB | 4.99 | 5.29 | 5.35 | 5.59 | 5.75 |
| BNZ | 5.19 | 5.29 | 5.35 | 5.59 | 5.75 |
| Kiwibank | 5.15 | n/a | 5.39 | 5.59 | 5.89 |
| Westpac | 5.19 | 5.45 | 5.29 | 5.59 | 5.75 |
| SBS | 4.99 | 5.29 | 5.29 | 5.59 | 5.75 |
| TSB | 4.99 | 5.45 | 5.39 | 5.69 | 5.99 |
| Estimated potential rate | 4.89 | 5.24 | 5.25 | 5.49 | 5.69 |
ANZ has no 4 or 5-year special. The bottom row is my estimate of what a borrower might be able to achieve below the advertised rate. An estimate, not an offer, and not a quote from any bank.
The advertised table understates what has happened to the rate a borrower actually gets, and that is the part I would draw your attention to this month. The discount below advertised has shrunk a good deal since September. Back then my estimate of an achievable two year rate sat about 0.20% below the sharpest advertised two year and about 0.27% below the big bank average. Today it sits about 0.04% below the sharpest and under 0.10% below the average. At one year the gap to the sharpest advertised rate has gone from about 0.16% to 0.10%, and at five years there is now a 0.06% gap where in September there was none. Put those together and the advertised two year has fallen 0.12% since the end of August while the two year a borrower can actually get has risen about 0.06%. A fair part of September’s swap rate increase has been absorbed through smaller discounts rather than through the advertised rates, which is why the advertised table has looked calmer than the pricing underneath it.
The Reserve Bank noted something similar on Wednesday, observing that banks have passed on less of the wholesale rise to lending rates than they usually would. On my numbers bank margins on the main fixed terms are still 0.15% to 0.20% below their normal levels, where a fortnight ago it was 0.25% to 0.30%. So I still expect some upward drift in the rates borrowers are offered if swap rates stay where they are, though less than I expected two weeks ago, and some of it will keep arriving as thinner discounts rather than as changes to the advertised table.
Inflation came in at 3.7% for the September quarter, below the Bank’s own 3.9% forecast and down from 4.1% in June. Wage growth is running at about 2% and inflation expectations have not moved. Against that, the core measures have crept up to around 3%, which is the top of the 1% to 3% target band, and the Bank now expects headline inflation to reach 4.4% in the December quarter because of fuel. The four members who voted to hold wanted time to see what the two increases already made are doing, and they put a lot of weight on weak household spending, which in their reading is stopping businesses from passing costs on. The three who voted to raise were more concerned that core inflation has sat above target for long enough to start working its way into how prices get set, and would rather act now than have to do more later.
The detail I found most useful was what those three said they wanted. Their case was for an increase “to around the mid-point of the neutral range”, which the September MPS puts at a bit over 3.2%. In other words, even the hawkish side of the Committee is arguing for a cash rate in the low threes, which is below where every bank except Kiwibank sees it going.
All seven members agreed that tighter policy is likely to be needed, and that the next six weeks of data could change that view in either direction. The Governor said afterwards that further increases at coming meetings are likely. The market took her at her word, with a December rise about 80% priced by the afternoon and the Kiwi dollar down about a cent.
Going into the decision all five banks had a rise pencilled in for October. Coming out of it all five have it on 9 December instead, and none has lowered its peak. ANZ and ASB both expect rises in December, February and March to 3.50% and then a hold, ASB having lifted its estimate of the neutral cash rate to 3.50% the week before. Kiwibank, who were pleased with the pause, expect 3.00% in December, another pause, and 3.25% at some point next year. BNZ expect a rise at every meeting until the cash rate reaches 3.75%, while conceding that the Bank will probably pause along the way, so by their own account it will take longer to get to the top than their published path shows. Westpac have the slowest climb and the highest peak: 3.00% in December, 3.50% by March, then two further rises in mid-2027 to 4.00%, easing back to 3.75% through 2028.
The Reserve Bank’s own projection is still the September one, which peaks at 3.28% in 2029, and Wednesday’s pause was consistent with it. A new projection comes with the 9 December MPS.
So the peaks now run from 3.25% to 4.00%, with the Reserve Bank at 3.28%. The wholesale market, even after Wednesday’s fall, is pricing a path that reaches about 4% by the end of next year and is still rising at the end of five years, above every forecast on the panel.
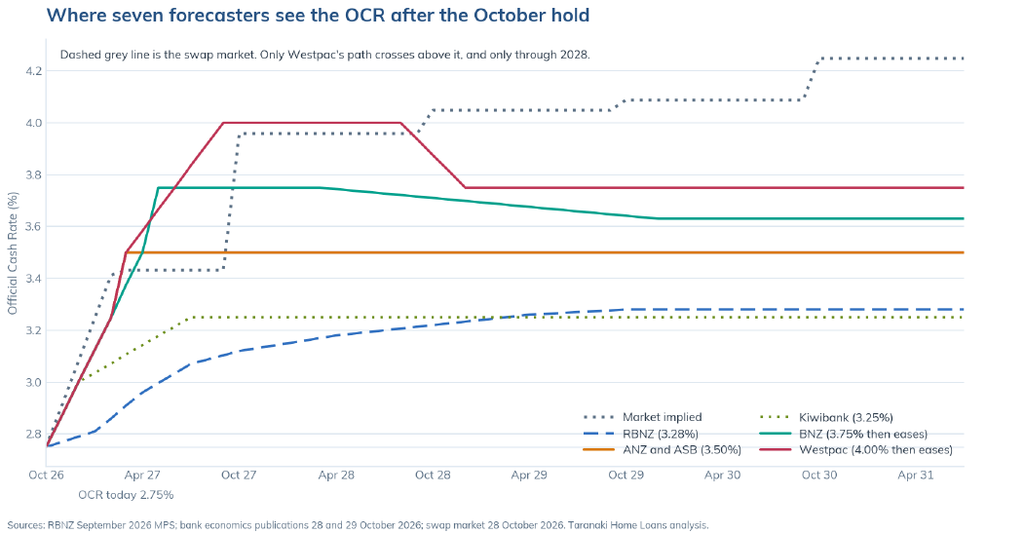
Graph 1: Where each forecaster sees the cash rate after the October hold, against what swap markets are pricing. ANZ and ASB now have the same path.
The simplest way to compare the terms is to ask what the one year rate would have to do for a longer fix to come out ahead. Fix two years at an estimated 5.25% rather than one year at 4.89% and you are paying 0.36% more for the whole of the first year. For that to be worth it, the one year rate you would otherwise roll onto next October has to be above 5.61%. The same arithmetic gives 5.79% for the three year, as the average one year rate across years two and three, and 5.89% for the five year, as the average across years two to five.
To test those bars against the forecasts I take each bank economist’s published cash rate path, and the Reserve Bank’s, and work out what the one year mortgage rate would be along it, using the usual relationship between the cash rate, swap rates and bank margins, with margins returning to normal over the coming year. The banks publish cash rate forecasts, not mortgage rate forecasts, so the mortgage rate figures in this article are mine, built from theirs.
| Decision | The one year rate has to be above | My projection of the one year rate, by cash rate forecast |
|---|---|---|
| Fix 2 years instead of rolling 1 year | 5.61% at your refix in October 2027 | 4.92% to 5.50% under five of the six forecasts. Westpac 5.76%. The market’s own pricing 5.70%. |
| Fix 3 years instead of rolling 1 year | 5.79% on average across years two and three | 4.97% to 5.66% under all six forecasts. The market’s own pricing 5.77%. |
| Fix 5 years instead of rolling 1 year | 5.89% on average across years two to five | 5.01% to 5.59% under all six forecasts. The market’s own pricing 5.86%. |
Breakevens on estimated potential rates, before any cash contribution. The one year rate figures are my projections from each forecaster’s published cash rate path, with bank margins returning to normal, not the banks’ own mortgage rate forecasts. Estimates, not offers.
So the two year only wins if the one year rate is above 5.61% a year from now, and on my projections only Westpac’s cash rate path gets it there, by 0.15%. Under the other five it falls short by 0.11% to 0.69%. The three and five year do not get there under any forecast, and even the wholesale market’s own pricing, which sits above every economist, comes in a touch under both bars. In dollars, on a $750K loan over five years, fixing two years costs $1,700 to $6,100 more than rolling under five of the six forecasts and ties under Westpac. Three years costs $2,900 to $13,300 more. Five years costs $9,300 to $26,400 more under every forecast. The full table is further down.
One other thing in those numbers. Bank margins on the longer terms are thinner than usual at the moment, about 0.21% below normal on the five year by my estimate, so a five year at a normal margin on today’s swap rates would be nearer 5.90% than 5.69%. That is why the longer fixes look less expensive than they did in September and why the two year premium has shrunk, and it is also the reason I expect the rates on offer to drift up if swap rates stay put.
My own view is that the cash rate ends up somewhere between 3.25% and 3.50% rather than at 4%, and I am inclined to take the Committee’s own dissenters at their word on that. The risk is still on the high side while headline inflation is heading for 4.4% and the currency is this weak, and I would not be surprised to be wrong on timing. On that basis:
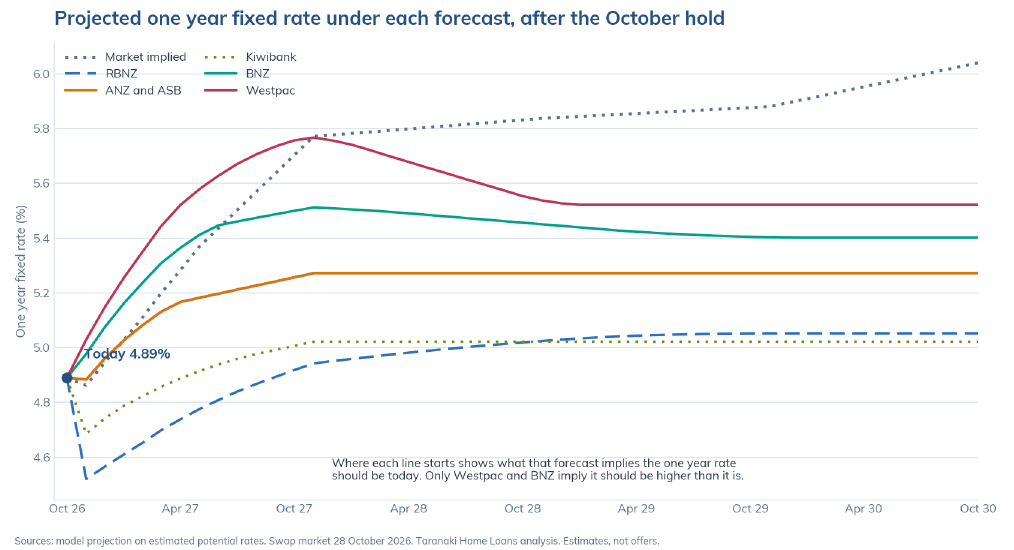
Graph 2: My projection of the one year rate at each annual rollover, built from each forecaster’s cash rate path, on estimated potential rates. Where each line starts shows what that path implies the rate should be today.
I have had a few calls this week from people hoping the hold means rates are about to come down, and I do not think it does. Swap rates are still well above where they were in August and the Reserve Bank has told us more increases are likely. What Wednesday did was take the most aggressive version of the market’s path off the table for now, which helps a one or two year rate a good deal more than it helps a five year one.
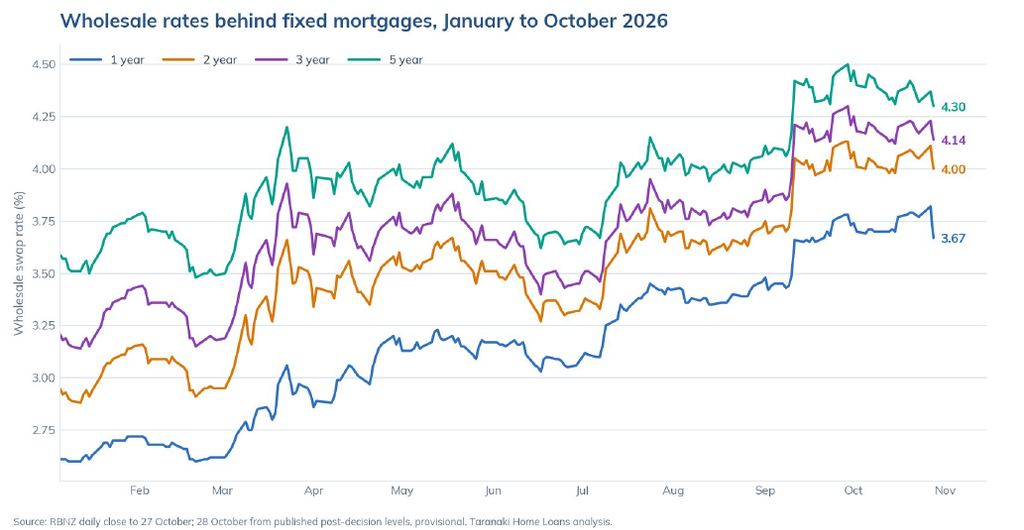
Graph 3: The wholesale swap rates behind fixed mortgages, January to October 2026. The last point is the 28 October level reported by bank dealing desks.
Advertised rates are sometimes the best available, but usually there is a bit of room below them, because banks keep a margin for negotiation. I cannot publish the exact rates, but my estimate of what a borrower might be able to achieve is about 4.89% for one year, 5.25% for two, 5.49% for three and 5.69% for five. These are estimates rather than offers, and what you are offered depends on your equity, your income and your banking relationship.
I ran my usual five year comparison on a $750K loan along the mortgage rate path I project from each cash rate forecast, as a real principal and interest loan with the repayment recalculated at every refix. The second line in each cell is the extra interest that longer fix costs against rolling one year fixes. The five year column is the same in every row, because a five year fix can only be taken at today’s rate.
| If this forecast is right | Roll 1 year | Fix 2 years | Fix 3 years | Fix 5 years |
| Reserve Bank (peak 3.28%) | $179,676 | $185,753+$6,077 vs rolling | $193,023+$13,348 vs rolling | $206,075+$26,399 vs rolling |
| Kiwibank (peak 3.25%) | $179,949 | $185,389+$5,439 vs rolling | $192,600+$12,651 vs rolling | $206,075+$26,126 vs rolling |
| ANZ (peak 3.50%) | $187,302 | $190,829+$3,527 vs rolling | $196,179+$8,877 vs rolling | $206,075+$18,773 vs rolling |
| ASB (peak 3.50%) | $187,302 | $190,829+$3,527 vs rolling | $196,179+$8,877 vs rolling | $206,075+$18,773 vs rolling |
| BNZ (3.75% then eases) | $192,424 | $194,138+$1,714 vs rolling | $198,075+$5,651 vs rolling | $206,075+$13,651 vs rolling |
| Westpac (4.00% then eases) | $196,822 | $196,661−$161 vs rolling | $199,761+$2,939 vs rolling | $206,075+$9,253 vs rolling |
| Wholesale market pricing | $204,736 | $204,760+$24 vs rolling | $205,863+$1,127 vs rolling | $206,075+$1,339 vs rolling |
Interest paid over five years on a $750K loan, principal and interest over 30 years, on my projected mortgage rates from each cash rate forecast, using estimated potential rates. The second line in each cell is the extra cost against rolling one year. Estimates, not offers.
Rolling the one year is cheapest in five of the six economist rows. In the Westpac row rolling two year fixes comes out about $161 cheaper, which I would call a tie, and both of them beat the five year by more than $9,000. The market row is close across all four strategies and I would not put weight on it either way, since it turns on where bank margins settle rather than on any view about the cash rate.
| If your priority is | Strategy | Why |
| Lowest cost | Roll 1 year | Cheapest or within $200 of cheapest under every forecast, and $9,300 to $26,400 ahead of fixing for five. |
| Certainty at a fair price | Fix 2 years | Costs $1,700 to $6,100 more than rolling under five of the six forecasts and ties under Westpac. The smallest premium for certainty this year. |
| Insurance against the market’s path | Fix 3 years | Costs $2,900 to $13,300 more than rolling. Only worth it if you think every economist is too low. |
| Not thinking about it again | Fix 5 years | Costs $9,300 to $26,400 more than rolling under every forecast. You are paying for certainty, which is reasonable, provided you know what it costs. |
| Flexibility to repay or sell | Variable, briefly | Expensive at over 6%. A short fix usually does the same job for less. |
Whichever term you land on, ask for a rate hold as soon as your window opens, either from your bank or through me. It costs nothing, lasts about 60 days, and if a better rate turns up in the meantime you simply take that instead.
Refixing before Christmas: take the rate hold now and fix for one or two years. The cards have not moved yet and margins still have a little to recover, so waiting into December is more likely to cost you than save you.
Refixing in January or February: you can reasonably wait for the 9 December MPS, which brings a new Reserve Bank projection. If that lands in the low threes, as the Committee’s own comments suggest it might, the two and three year rates could come down a little further. Get the hold anyway, since it costs nothing.
Still on a 2022 to 2024 rate:
ask Rupert to check your break position. Swap rates are higher now than when most of those loans were fixed, so break costs are usually small or nil.
Not by much, and possibly not at all. Swap rates fell about 0.10% to 0.15% on the day, but the banks had not fully passed on the September rise in the first place and their margins are still below normal. My expectation is that advertised rates sit roughly where they are for now, and that the discounts below them stay thinner than they were in the middle of the year.
No. The Committee said the next six weeks of data could change its view in either direction. That said, all five bank economics teams expect a rise then, the market has it about 80% priced, and the Governor said further increases are likely, so I would plan on it.
Because you pay that 0.36% for the whole of the first year, and the one year rate then has to be above 5.61% next October for the two year to make the difference back. On my projections, five of the six cash rate forecasts do not get it there, and under those the two year costs $1,700 to $6,100 more over five years on a $750K loan. Under Westpac’s forecast it is a tie.
It depends what you mean by safe. A five year fix removes the uncertainty, and for some people that is worth paying for. On a $750K loan it costs $9,300 to $26,400 more than rolling one year fixes over five years under every forecast I follow, including the two that expect the cash rate to reach 4%. That is the price of the certainty.
Usually, yes, though less than a few months ago. Banks hold a negotiating margin below their advertised specials, and how much of it you get depends on your equity, your income and how much you are borrowing. The figures in this article are estimates of what a borrower might be able to achieve, not a quote from any bank.
The hold narrowed the gap between what swap rates are charging for and what the economists expect, without changing the rates borrowers are actually offered. On those rates, and on my projections from the published cash rate forecasts, rolling one year fixes is still cheaper than any longer term under nearly every one of them: two years costs $1,700 to $6,100 more under five of the six and ties under the sixth, three years $2,900 to $13,300 more, and five years $9,300 to $26,400 more. The premium for certainty is smallest at two years and that is where I would buy it. That keeps me on one year for cost and two years for certainty, with a rate hold in place, and I would want to see the December MPS before committing to anything longer. If your rate expires in the next few months, get the hold first and then talk the term through with an adviser.
Reserve Bank
Free Mortgage Review Information
General information only, not personalised financial advice. Figures are illustrative and use advertised special rates unless noted as estimates. Your situation will differ. Talk to an adviser before deciding. Rupert Hunt is a New Zealand financial adviser.